
Methodology to Establish SDG 3 Targets and Reduce Inequalities |
SUSTAINABLE DEVELOPMENT GOAL 3:
|

The methodology proposed below presents a target achievement algorithm designed to simultaneously establish quantitative targets for the national average of an SDG 3 health indicator and to bridge its geographical inequality gaps. This methodology requires disaggregated geographically relevant data from the subnational level (for example, by department, state, province, municipality, canton, district, etc.). The algorithm is based on a criterion of proportional progressive improvement in the speed of change of the indicator in question and generates average targets and inequality gaps that are consistent with each other, which facilitates monitoring and accountability with respect to the commitment to “leave no one behind.”
If information on a health indicator is available at two established times (t0 and t1), it is possible to calculate its average annual percent change (AAPC) by applying the following expression:
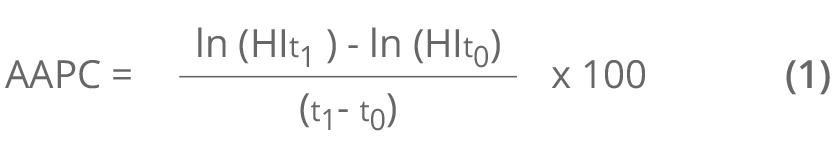
In general, the AAPC value obtained with expression (1) reflects the speed of change of a health indicator over time. If the indicator has negative polarity (that is, when a lower value of the health indicator over time indicates a more favorable situation, for example, mortality), the AAPC reflects the average annual percent decrease. If, on the contrary, the indicator has positive polarity (that is, when a higher value of the health indicator over time indicates a more favorable situation, for example, care coverage), the AAPC reflects the average annual percent increase.
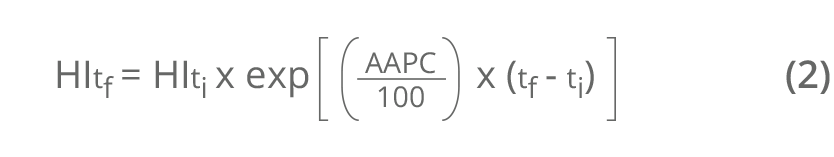
Presuming that a health indicator’s AAPC is known as is a value of the indicator at an initial time (ti), the value of the health indicator at a future time (tf) can be estimated by applying the following expression:
The estimate of a health indicator at a future time can be expressed in relative terms (that is, as a percentage of the initial time value). This can be calculated using the expression for the percent change (PC) of the indicator between the initial time (ti) and the future time (tf), as follows:

The absolute gap (AG) and the relative gap (RG) are simple summary metrics of health inequality and correspond to the arithmetic difference and quotient, respectively, in the value of the health indicator between two groups at opposite ends of geographical stratification. Let us say there are four geographical strata for some health indicator. The geographical inequality gap metrics are calculated according to the following expressions:

where q1 is the first stratum (that corresponds to the stratum with the health indicator in a worse situation) and q4 the fourth stratum (that corresponds to the stratum with the health indicator in a better situation). The AG is expressed in the same units of measure as the health indicator. An AG equal to 0 denotes absence of inequality. The RG is expressed without units of measure (that is, its value represents the number of times that the numerator fits into the denominator). An RG of 1 denotes absence of inequality.
Step 1. Calculate the national AAPC of an SDG 3 indicator based on a known time series between the initial time and a reference year, applying expression (1).
Step 2. Determine the geographical strata:
- Order the geographical values of the health indicator for the initial time according to its polarity (that is, from higher to lower if it has negative polarity, or in ascending order if it has positive polarity).
- Identify the cut-off points that define the geographical strata, either by pre-established categories (for example, above and below an established national reference value) or by groups (for example, quintiles, quartiles, or terciles).
- Calculate the (weighted) average of the health indicator for each geographical stratum thus defined.
Step 3. Apply the criterion of AAPC proportional progressive improvement to each geographical stratum defined:
- If the health indicator has negative polarity, assign a proportionately higher AAPC the higher the health indicator of the stratum, guided by the proportionality factor.
- If the health indicator has positive polarity, assign a proportionately higher AAPC the lower the health indicator of the stratum, guided by the proportionality
- In any case, make sure that the arithmetic average of the AAPC of all the strata equals the national average AAPC at the initial time (applied in step 1).
Step 4. Determine the targets at the subnational and national level:
- Calculate the value of the health indicator at a future time for each territorial unit (subnational target) with expression (2).
- Calculate the weighted average of the values of the health indicator in all territorial units at a future time (national target).
- These results represent the subnational and national targets for the SDG 3 indicator in absolute terms. Expression (3) produces the targets in relative terms.
Step 5. Determine the geographical inequality gap reduction targets:
- Calculate the AG and the RG applying expressions (4) and (5) at the initial and future times.
- Obtain the percentage changes of the AG and RG for the period by applying expression (3).
- These results represent the geographical inequality gap reduction targets for the SDG 3 indicator (distributional targets) in absolute and relative terms, respectively.
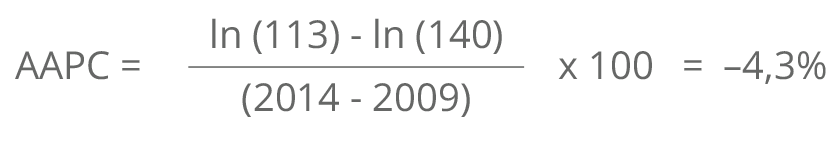
The data presented in this application were used to draft the inequity profile in women's, children’s, and adolescent health prepared by Guatemala.[1] The example here shows the maternal mortality ratio (MMR), which expresses the number of maternal deaths per 100,000 live births in a given year. In accordance with step 1 of the target achievement algorithm, the national AAPC of the MMR was calculated based on MMR data for 2009 (140 maternal deaths per 100,000 live births) and 2014 (113 maternal deaths per 100,000 live births), which corresponds to the national average for those years, replacing these values in expression (1):
The first numerical column of Table 1 shows the values of the MMR in Guatemala in 2014 by department, ordered from higher to lower. In accordance with step 2, based on this ordered geographical distribution of the initial MMR, groups have to be identified in departments or geographical strata to establish the contribution of the subnational levels to achieving the MMR target for 2030.
Table 1. Initial subnational values of the maternal mortality ratio in 2014 in Guatemala and departmental targets for 2030
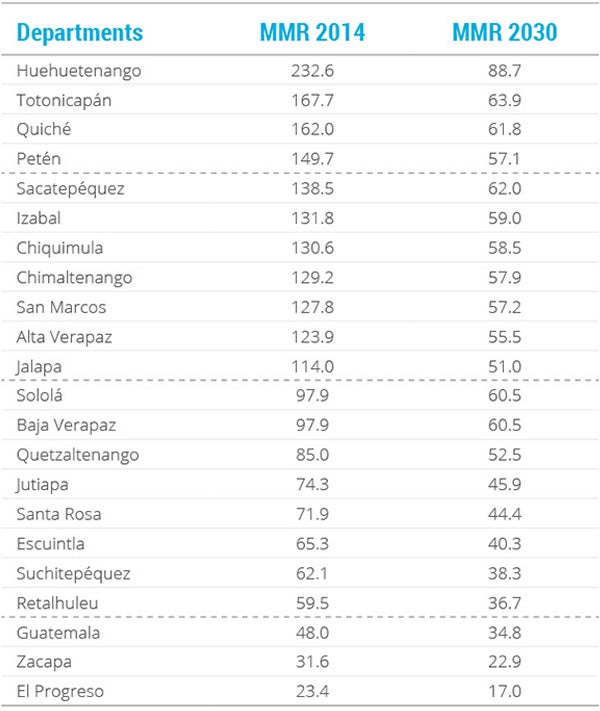
Notes: The dotted lines separate the four groups of departments, going from highest to lowest maternal mortality ratio in 2014.
MMR: maternal mortality ratio.
In this application, four department groups were established normatively according to MMR in 2014. These four geographical strata remained well-defined on the basis of two criteria: first, a national MMR reference value for 2030 calculated from the national AAPC (‒4.3%) and the initial national MMR (113 maternal deaths per 100,000 live births) applying expression (2); and second, a maximum threshold equivalent to double the SDG 3 global target for this indicator (140 maternal deaths per 100,000 live births). In this way, the four strata group the departments as follows: above the maximum threshold (group 1); below the top stratum but more than double the national reference value (group 2); less than double the national reference value but above the reference value (group 3); and below the national reference value (group 4).
Based on step 3 of the algorithm, each of these four geographical strata were assigned different AAPC intensity, following the proportional progressive improvement criterion: it is believed that the higher the MMR in the department, the faster the reduction (that is, the AAPC) should and could be; while the lower the MMR, the lower the AAPC should be (this is due to the so-called principle of diminishing returns). Table 2 presents the geographical strata determined by the criteria established in this application, as well as the values of AAPC assigned to each of these four groups. Note that the average group AAPC equals the national average AAPC obtained in step 1.
Table 2. Department strata and levels of average annual percent change according to 2014 maternal mortality ratio values
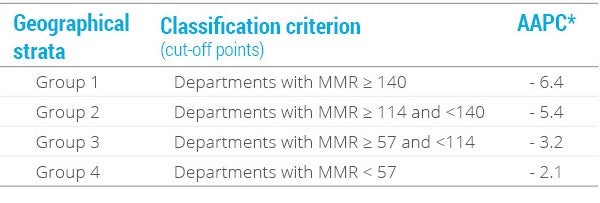
Notes: *The average of these values equals ‒4.3, which is the national AAPC calculated in step 1.
MMR: maternal mortality ratio; AAPC: average annual percent change.
By extension, if we consider the initial MMR levels (2014), the AAPC values for each geographical stratum (Table 2), and apply expression (2), it is possible to obtain the MMR target that each department of the country should reach by 2030, as presented in the second numerical column of Table 1.
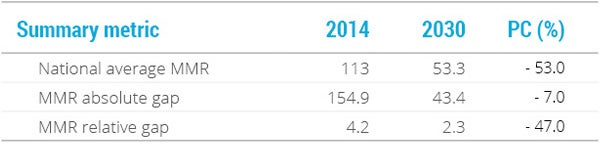
Using step 4 of the algorithm, based on the new departmental distribution of MMR for 2030, the national MMR value was calculated, expressed as the average weighted by the population size of live births in every department (projected for 2030). This weighted average represents the national target in absolute terms, which equals 53 maternal deaths per 100,000 live births by 2030. In relative terms, the national target is expressed as a 53% reduction of the national MMR from 2014 to 2030.
Finally, using step 5 of the algorithm, with the MMR values for the initial year and the target year corresponding to strata 1 and 4 (i.e., the extreme strata of the abbreviated distribution), the respective inequality gaps (AG and RG) were calculated using expressions (4) and (5).
Table 3 summarizes the initial values, as well as the joint targets for reducing the national average and the geographical inequality gaps (AG and RG) in the maternal mortality ratio for the country by 2030:
- in absolute terms, a national target of 53 maternal deaths per 100,000 live births by 2030 or, in relative terms —and according to expression (3)—, a 53.0% reduction in the MMR between 2014 and 2030;
- a target of reducing the MMR absolute gap by 72.0% between 2014 and 2030, and
- a target of reducing the MMR relative gap by 47.0% between 2014 and 2030.
Table 3. Maternal mortality ratio in Guatemala: national average and absolute and relative inequality gaps in 2014 and targets for 2030
RMM: maternal mortality ratio; PC: percentage change.
[1] Every Woman, Every Child. Situation of social determinants of health in Guatemala. Panama: APR LAC; 2015. Available from: https://www.everywomaneverychild-lac.org/paises/.