
Methodology for Regional and National Monitoring of SDG 3 Targets, Indicators, and Inequalities |
SUSTAINABLE DEVELOPMENT GOALS 3: |
The methodology proposed below complies with the general and specific recommendations of the World Health Organization (WHO) set forth in the following three policy documents:
- Monitoring, evaluation, and review of national health strategies: a country-led platform for information and accountability (2011)
- Handbook on health inequality monitoring: with a special focus on low- and middle-income countries (2013)
- National Health Inequality Monitoring: a step-by-step manual (2017)
The methodology consists of the following two main components:
- Monitoring of the indicators for the targets in Sustainable Development Goal 3 (SDG 3)
- Monitoring of inequalities in the indicators for the targets of SDG 3
Furthermore, it covers two major areas:
- Regional
- Nacional
Figure 1. Basic flow chart for monitoring inequality in health
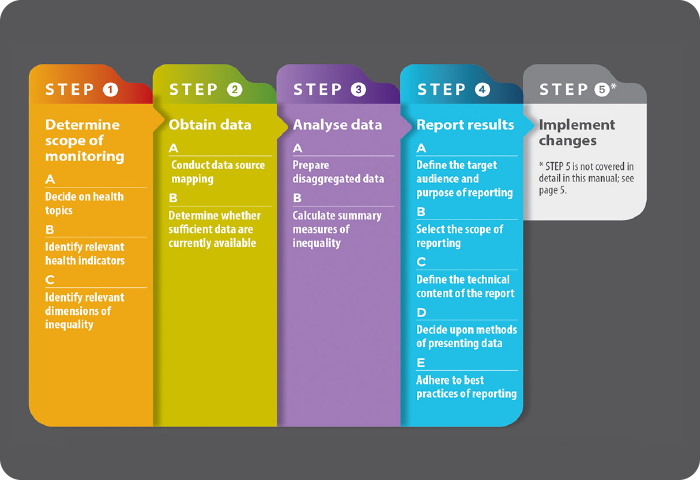
- Select the list of indicators for the SDG 3 targets that will be validated, collected, and monitored by each country, out of the total of 27 indicators identified. For the selected indicators, establish 1) their definitions and technical specifications, and 2) the calculation methods that will be used.
- For monitoring the SDG 3 indicators themselves, it is recommended to make a minimum selection that covers each of the following six categories of indicators:
-
- Maternal and child health: 1.1, 3.2.1, 3.2.2
- Communicable diseases (GBD.1[1]): 3.1, 3.3.2, 3.3.3., 3.3.4, 3.3.5
- Noncommunicable diseases (GBD.2): 4.1
- Injuries (GBD.3): 4.2, 3.6.1, 3.9.3
- Health hazards: 5.2, 3.7.2, 3.9.1, 3.9.2, 3.a.1
- Access to health services and health service coverage: 1.2, 3.5.1, 3.7.1, 3.8.1, 3.8.2, 3.b.1, 3.b.2, 3.b.3, 3.c.1, 3.d.1
-
- To monitor inequality in health, agree on a subset of basic tracer indicators of health inequalities (BTIHIs) from the list of 27 indicators for the SDG 3 targets. This subset of BTIHIs should be common to all countries and the agreed selection criteria must:
- consider the four BTIHIs already selected to monitor the impact level 1 indicator in the Strategic Plan of Pan American Health Organization 2020-2025: “reduction of within country health inequalities.”
- cover the four basic stages of the life course (early childhood, adolescence and youth, adulthood, and old age).
- cover the two basic dimensions of health (health outcomes and contact with the health services system).
- cover, as much as possible, the six categories of indicators indicated above.
- The following basic list of BTIHIs is proposed:
- Neonatal mortality rate (3.2.2)
- Adolescent birth rate (aged 10-14 years; aged 15-19 years) per 1,000 women in that age group (3.7.2)
- Tuberculosis incidence per 100,000 population (3.3.2)
- Mortality attributed to cardiovascular disease, cancer, diabetes, or chronic respiratory disease (3.4.1)
- The list can be expanded with the following BTIHIs:
- Death rate due to road traffic injuries (3.6.1)
- Coverage of essential health services (3.8.1)[1]
- Health worker density and distribution (3.c.1)
- Proportion of births attended by skilled health personnel (3.1.2)
- Proportion of women of reproductive age (aged 15-49 years) who have their need for family planning satisfied with modern methods (3.7.1)
- Proportion of the target population covered by all vaccines included in their national program (3.b.1)
- Maternal mortality ratio (3.1.1)
- Reach a consensus on the possible magnitude of inequality (i.e., stratify equity). In principle, it should include the stratifiers included target 11.1 of the Sustainable Health Agenda for the Americas (SHAA 2030), namely: place of residence (urban/rural); race, ethnic group; occupation; gender, sex; age; education, or socioeconomic status. It is recommended that at minimum, a consensus be reached on an equity stratifier that represents at least one of the three dimensions of sustainable development (social, economic, and environmental), or a population group recognized to be in a situation of greater social vulnerability, together with the equity reference population group (i.e., the comparison group).
[1] GBD: global burden of disease. [2] Once this indicator is devised and enjoys a global consensus (in which case, any redundant indicators would be eliminated).
- Monitoring relies on the periodic availability of comparable data (health, population, and social) from recognized official institutional sources. Accordingly, it is necessary to critically examine all sources of information (both within and outside the sector) in terms of their usefulness for institutionalizing the proposed monitoring in the country (i.e., mapping of data sources), including an objective assessment of their strengths and limitations.
- To monitor inequalities in SDG 3, the BTIHIs should be disaggregated subnationally or by geopolitical criterion (at least the first level of geopolitical disaggregation; ideally, at the level of municipality or district), or else categorized based on individual microdata from surveys.
- The equity stratifying indicators should be disaggregated at the same level as the BTIHIs, or by geopolitical criterion, or else categorized based on microdata (that is, at the individual or household level) from surveys.
- It is recommended, in principle, to give special importance to the use of socio-geographically disaggregated data,[3] according to their availability and the level of development of national initiatives on core health data. It is also recommended to favor the use of survey data (for example, demographic and health surveys, multiple cluster indicator surveys, and reproductive health surveys), when available and as a means of verifying internal consistency over time of the magnitude, trends, and patterns of distributive inequality in the BTIHIs, depending on how representative they are..
Establishment of quantitative national targets
This proposal suggests the establishment of quantitative national targets as a methodological step for monitoring population health in general, and SDG 3 and its inequalities in particular, since the assessment of progress toward a desired goal gains objectivity when the milestone or expectations are explicitly defined, which in turn strengthens accountability. Indeed, implementation of the 2030 Agenda for Sustainable Development implies the adoption of national targets for each SDG, quantitatively adapting the global targets to local conditions. In order to establish the national targets for the SDG 3 indicators, this proposal applies a simple method based on the average annual percent change in time series. Alternatively, it also considers the use of a complex method based on multivariable regression models. In order to establish the targets for the basic tracer indicators of health inequalities, an algorithm is proposed that measures progressivity between social strata consonant with the established national target. Alternatively, the use of historical patterns of inequality can be considered, as well as multivariable regression models in specific or targeted subnational social groups.
[3] Data that are geographically disaggregated and ordered hierarchically in accordance with one social variable: the equity stratifier. This is an ecosocial approach to monitoring health inequality.
- Data analysis for monitoring both the SDG 3 indicators and their inequalities, normatively including the following three components:
- Analysis of the current situation
- Analysis of changes over time
- Referential analysis
- Data analysis for monitoring also includes the construction or calculation of specific metrics, namely:
- Summary metrics: national average (for monitoring the SDG 3 indicators).
- Standard inequality metrics: absolute gap (arithmetic difference in BTIHIs between opposite ends of the equity stratifiers), relative gap (simple BTIHI quotient between opposite ends of the equity stratifiers); absolute gradient (slope index of inequality obtained by nonlinear weighted regression) and relative gradient (concentration index obtained from the disproportionality curve between population and health allocations).
- Change metrics: percentage change and average annual percent change in two periods.
- Uncertainty metrics: confidence intervals (95%).
- There are four basic analytical steps:
- Calculate the national average for each SDG 3 indicator (including BTIHI).
- Calculate the average for each category of equity stratifier for each BTIHI.
- For each BTIHI, calculate the four standard metrics of social inequality in health (absolute gap, relative gap, absolute gradient, and relative gradient), without prejudice to other metrics for specific situations.
- For each standard measure of inequality (SMI), compute the annualized proportional reduction rate (APRR):[4]

[4] La TRPA para MED equivale a la brecha absoluta de los cuatro ITBDS notificados para el indicador a nivel de impacto 1 del Plan Estratégico 2020-2025.
- Facilitate a standard interactive dashboard of results that each country can adapt to its national context.
- The dashboard will be designed to visualize, with a territorial emphasis: 1) monitoring of the current situation; 2) changes over time; and 3) referential analysis of the current situation and changes over time at the regional, national and, where applicable, subnational level.
- The dashboard could interface with the WHO Health Equity Assessment Toolkit (HEAT) and with its new edition, HEAT Bonus, to automate the calculation of standard measures of inequality.
- The numerical, tabular, and graphic information generated by the dashboard can be used to periodically generate (for example, biennially) national profiles of inequality in the BTIHIs of SDG 3, or a regional monitoring report on the SDG 3 indicators and their inequalities.