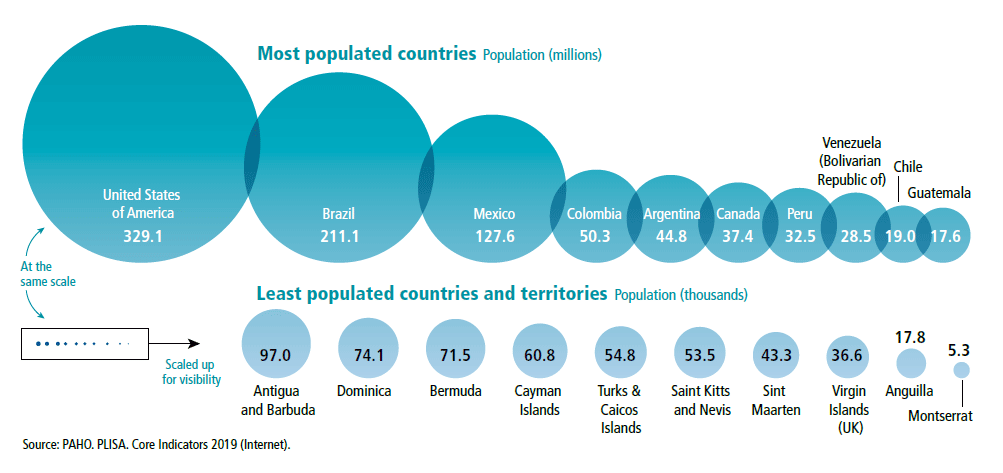
Population 2019
THE TOTAL POPULATION OF THE AMERICAS was 1.01 billion inhabitants in 2019, having surpassed the 1-billion threshold in 2017. In the last 25 years, the Region as a whole has grown by 31%. In 2019, the 10 countries with the largest populations comprised 89% of the Region’s total, and they have grown by 30% since 1995. In contrast, the 10 countries with the smallest populations comprise just 0.05% of the regional population; however, they have grown by 42% since 1995
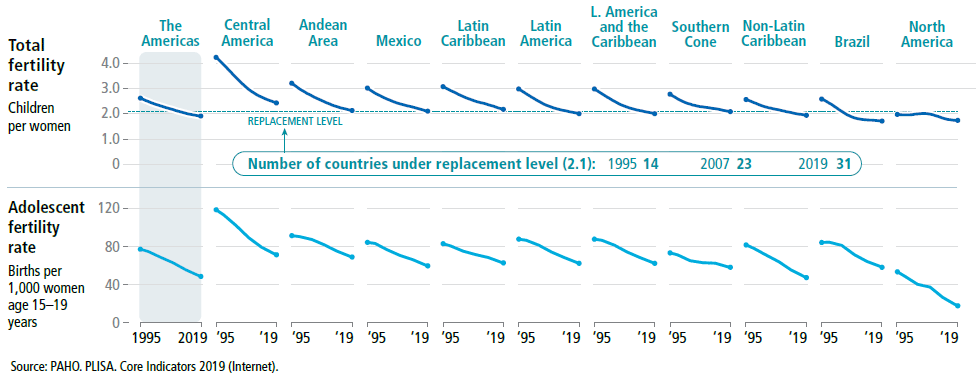
Total fertility and adolescent fertility rate
by subregion, Region of the Americas, 1995–2019
TOTAL. Over the last 25 years, the fertility rate in the Americas has decreased from 2.6 in 1995 to 1.9 in 2019, falling below the replacement-level fertility of 2.1, the value which represents the average number of children per woman to ensure a stable population size. A fertility rate below 2.1 means that the population will decrease over time.
ADOLESCENT. There were an estimated 48.3 births per 1,000 women age 15–19 years in the Americas in 2019. However, these rates vary widely among countries. In North America, the adolescent birth rate is 17.6, while in Central America it is 71.1. Although the rate decreased by 37% in the 25-year period, teenage pregnancy rates in the Americas remain among the highest, globally
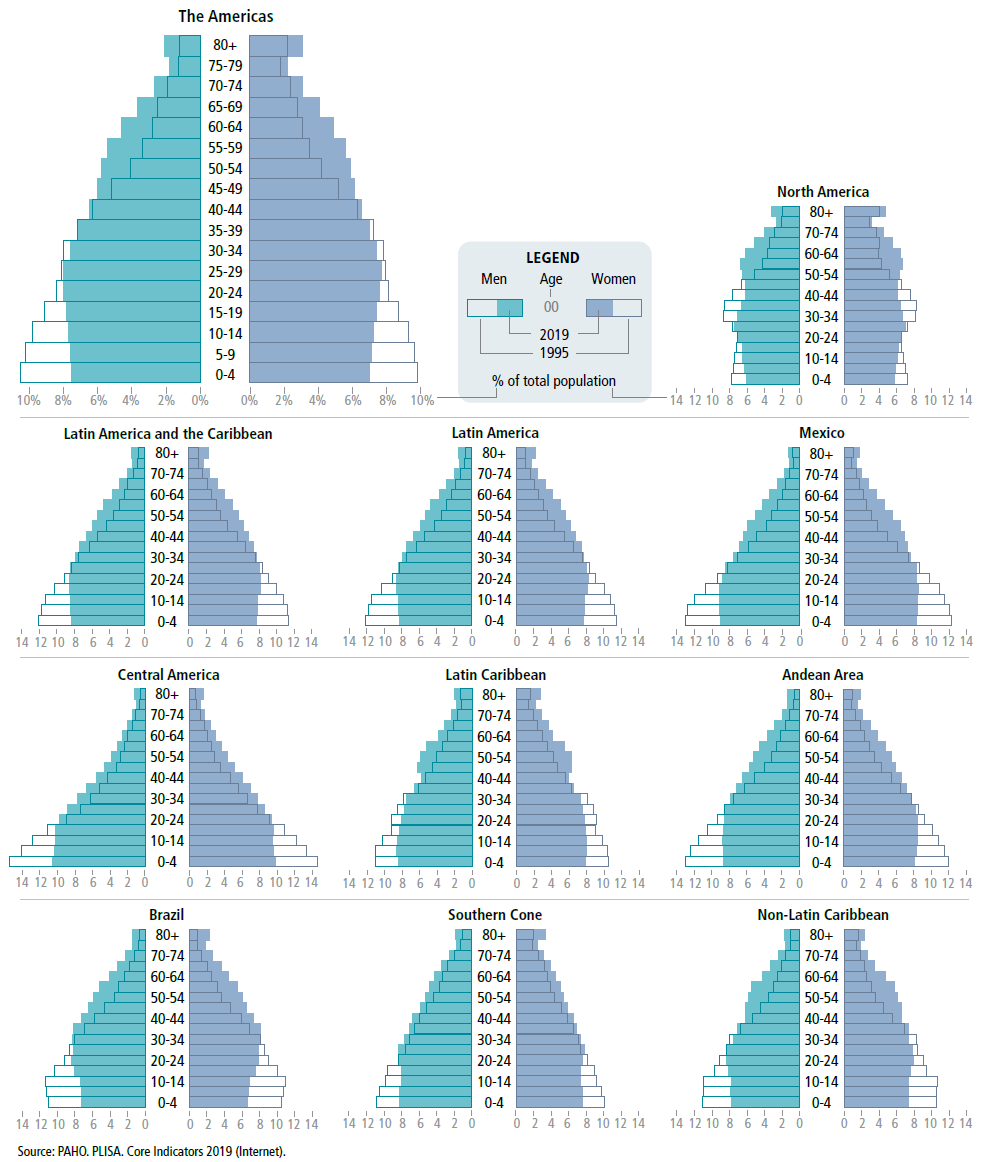
Demographic transition
by subregion, Region of the Americas, 1995–2019
THE DEMOGRAPHIC TRANSITION OBSERVED IN 1995 continues today in the Americas. The change in population distribution from a young population to an aging one is noticeably higher in the Region, with subregions experiencing different stages. In 1995, populations were characterized by higher fertility and lower life expectancy, while in 2019, all subregions except North America observe an aging population. North America's pyramid presents an already advanced stage of an older population structure, with women slightly outnumbering older men.
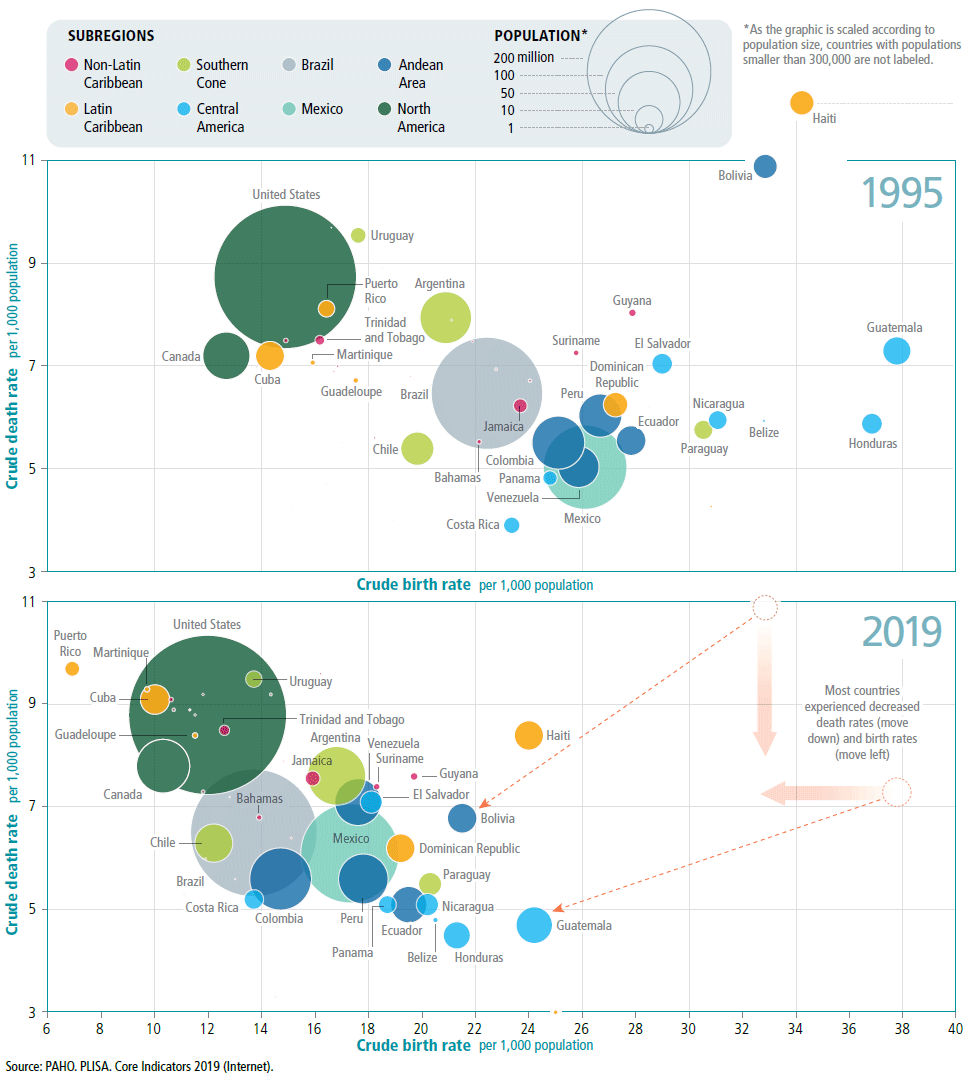
Birth and death rates
by country and subregions of the Americas, 1995 and 2019
IN THE 25 YEARS SINCE 1995, all countries and territories in the Americas experienced a decrease in their crude birth rate. In some countries, this change was accompanied by a similar reduction in their crude death rate. Other countries experienced no change in their crude death rate, while still others observed an increase in their crude death rate. For example, the crude death rate in Bolivia decreased from 10.9 in 1995 to 6.8 per 1,000 population in 2019 and the crude birth rate decreased from 32.8 to 21.5 per 1,000 population during the same period. Similar trends are observed for Guatemala. These dynamics reflect the different maturation stages in each country’s demographic and epidemiological transitions
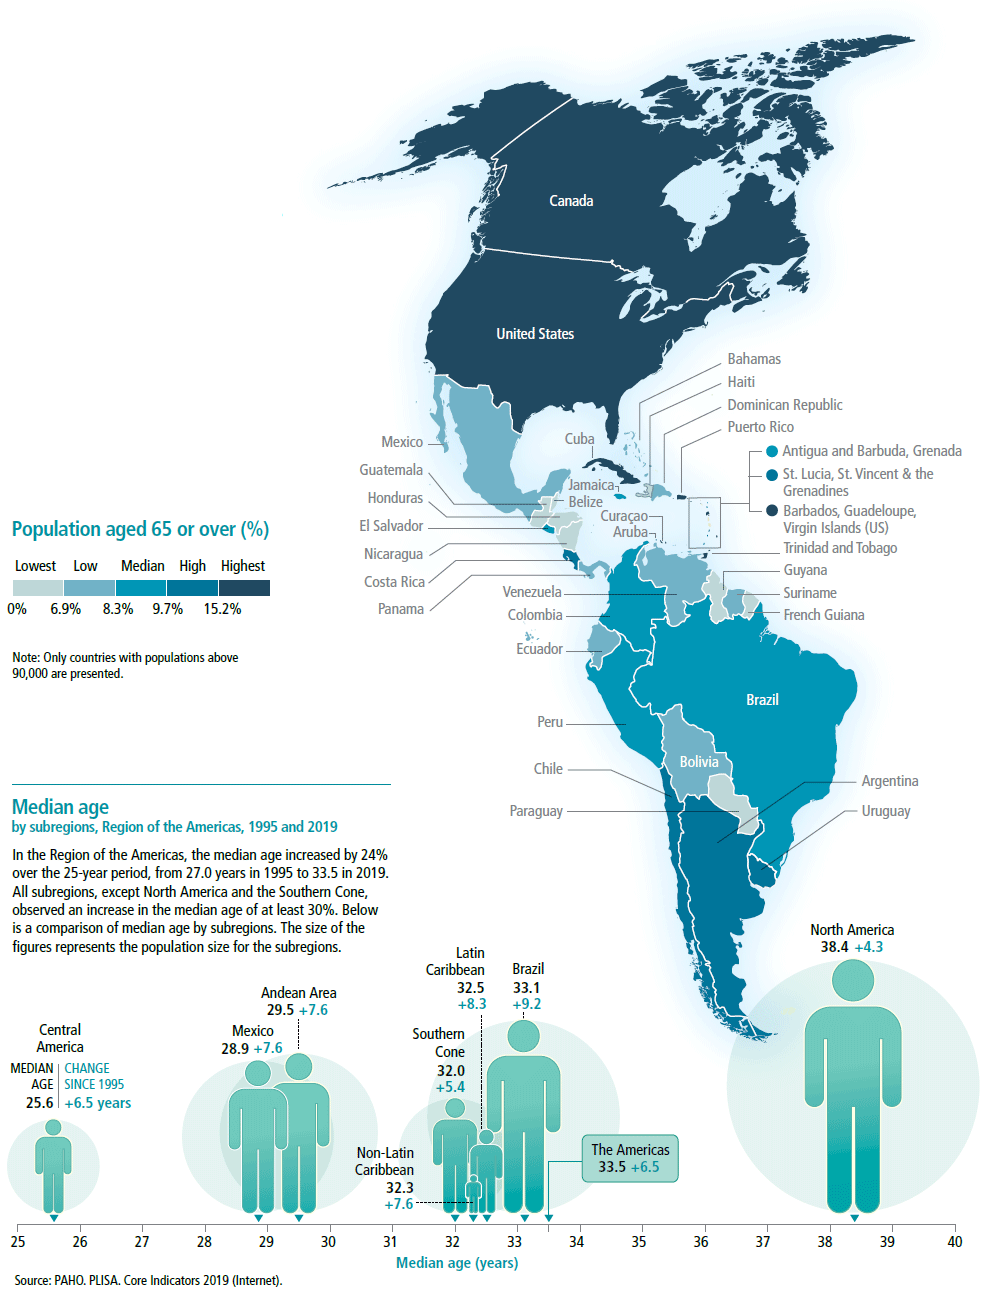
Aging population
by country, Region of the Americas, 1995 and 2019
IN 2019, THERE WERE 116 MILLION people age 65 years or over in the Americas, accounting for 12% of the Region's total population. This is almost double the number from 1995, when there were 62 million older adults in the Americas, representing 8% of the total population at that time. Apart from Canada and the United States of America, the countries with the highest proportion of an older adult population are in the Caribbean.
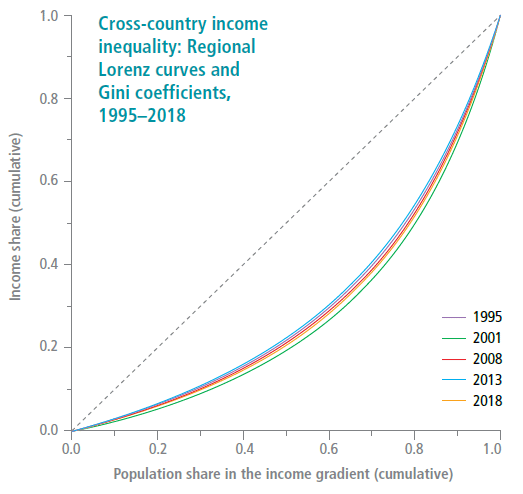
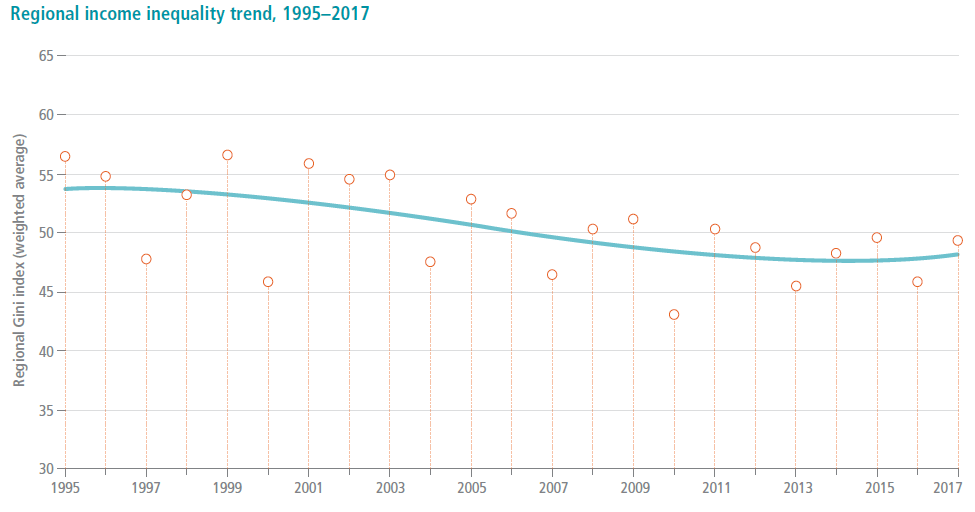
Income inequality
Region of the Americas
THE AMERICAS IS ONE OF THE MOST INEQUITABLE REGIONS OF THE WORLD with respect to income distribution when comparing countries. This income inequality generates inequality in other social determinants, which, in turn, produces inequalities in health. The Gini index is a measure of disproportionality in the distribution of income among members of a population, ranging from 0 (equality) to 100, and is sometimes used as a proxy for measuring wealth. The graph shows the 1995–2017 trend in the weighted average of national Gini index, which highlights 1) the extreme level of income inequality (approximately 50% over time) and 2) the well-documented Gini index decrease by more than 10 percentage points during the Millennium Development Goals (MDGs) period (from 57% in 1999 to 46% in 2016).
The graph to the right includes five Lorenz curves of regional income inequality over this time, using the gross national income per capita (GNI). It illustrates the persistence of income inequality in the Americas: the poorest 20% of countries have an income share of about 6% (that is, 6 out of every 100 dollars), whereas the richest 20% of countries have an income share close to 48%. That gap between the Lorenz curve and the diagonal line representing equality must be bridged in order to leave no one behind.
Source: PAHO. PLISA. Core Indicators 2019 (Internet). Analysis: PAHO/WHO. Department of Evidence and Intelligence for Action in Health, 2019.