The data shown in this page are part or the archive and were updated in Sep 25, 2019. For current information use the navigation menu.
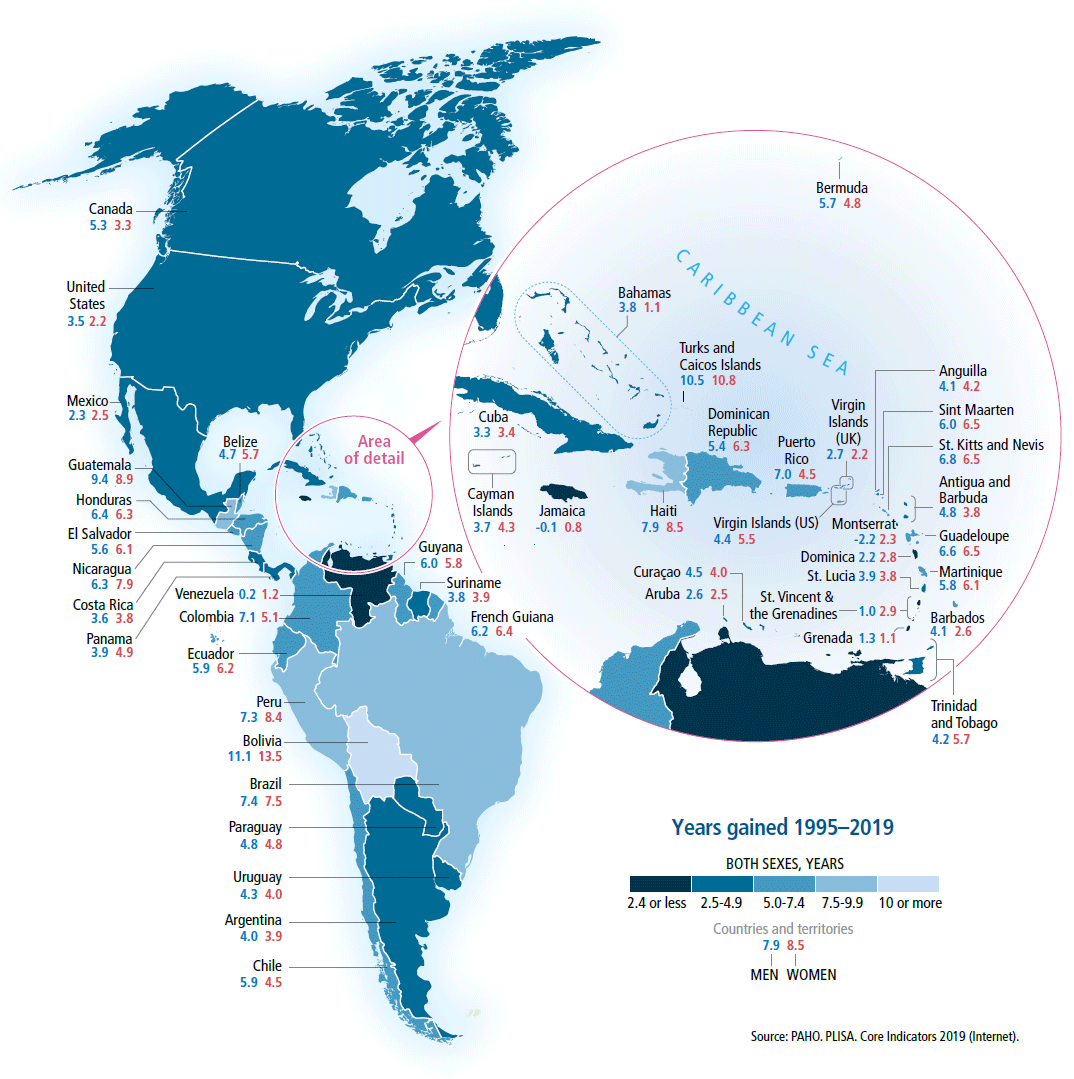
Years gained in life expectancy at birth
by country, Region of the Americas, 1995–2019
IN THE LAST 25 YEARS, THE AMERICAS MADE IMPORTANT PROGRESS in increasing the life expectancy from 72.3 to 76.9 years. The Plurinational State of Bolivia had the greatest gain in life expectancy, for both women and men (14 and 11 years, respectively). Other notable increases in total life expectancy are observed in Turks and Caicos (10.6 years), Guatemala (9.2 years), Haiti (8.2 years), Peru (7.8 years), and Brazil (7.6 years). Much smaller increases in life expectancy are observed for Grenada (1.0 year), the Bolivarian Republic of Venezuela (0.7 year), Jamaica (0.3 year), and Montserrat (0.1 year).
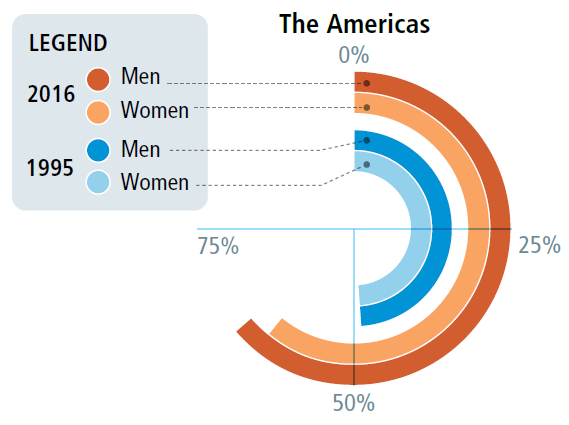
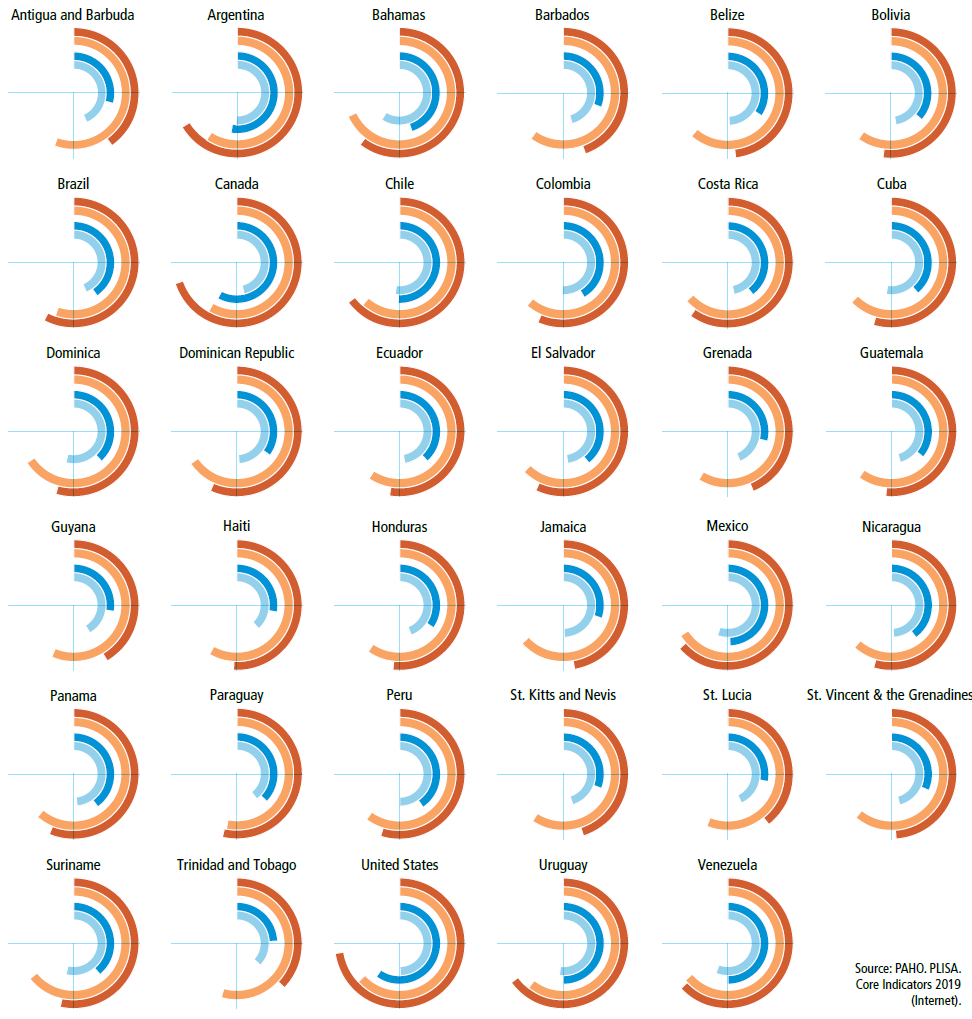
Adult overweight and obesity
by country, Region of the Americas, 1995 and 2016
OVERWEIGHT AND OBESITY (defined as having a body mass index ≥25 kg/m2) are major risk factors for cardiovascular diseases, diabetes, and some types of cancer. The prevalence of overweight and obesity has dramatically increased over the past 20 years. Countries with the highest prevalence of overweight and obesity are the United States of America (68%), Mexico (65%), Canada, and the Bahamas (both 64%).
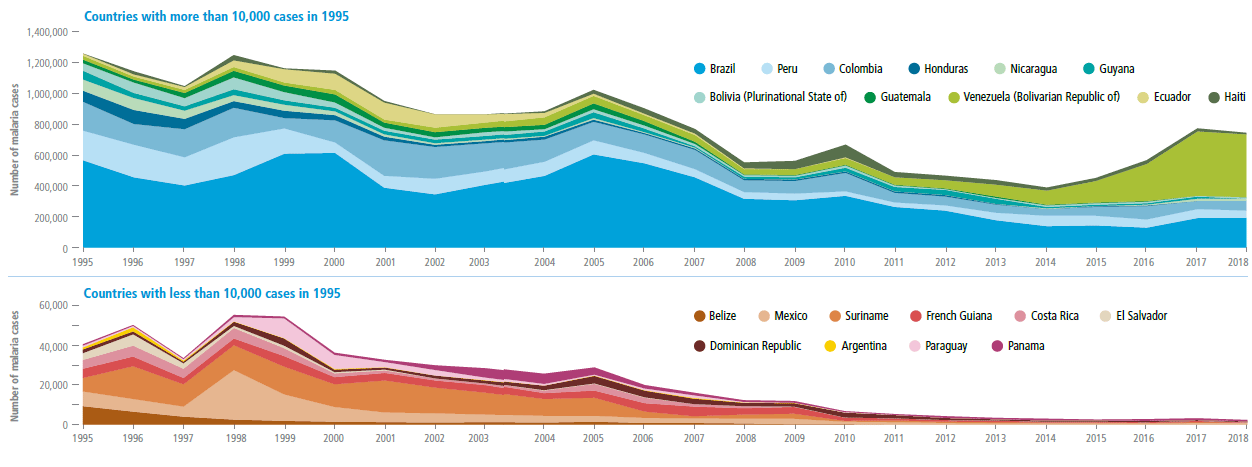
Malaria
by endemic country, Region of the Americas, 1995–2018
MALARIA INCIDENCE IN THE AMERICAS decreased over the past two decades, although more recently there have been increases associated with local outbreaks and epidemics in a few countries. In 1995, the Region had 21 malaria-endemic countries. Since then, WHO has certified Paraguay (in 2018) and Argentina (in 2019) to have eliminated malaria. Several countries have also observed significant decreases in malaria cases, especially Ecuador and Suriname–each of which had an outbreak in 2001 and 1996, respectively. The increased malaria incidence in Haiti was associated with the aftermath of the 2010 earthquake
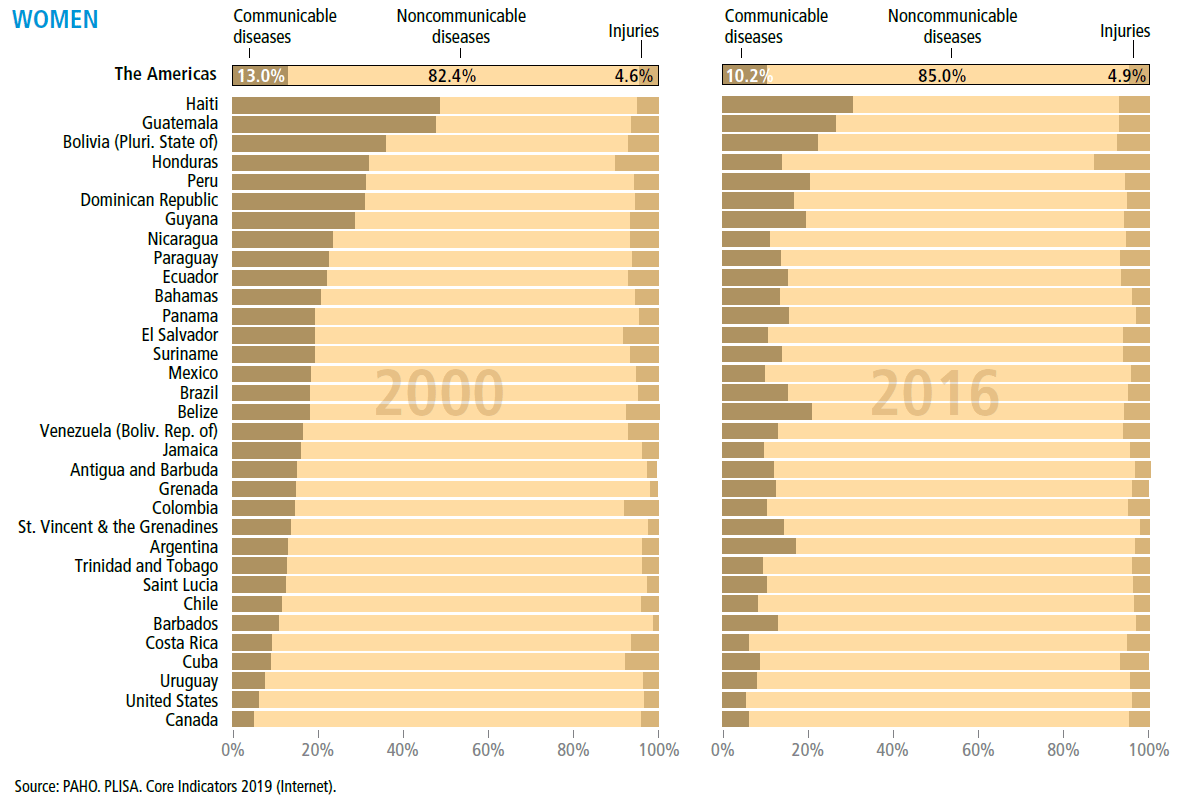
Source: PAHO. PLISA. Core Indicators 2019 (Internet).
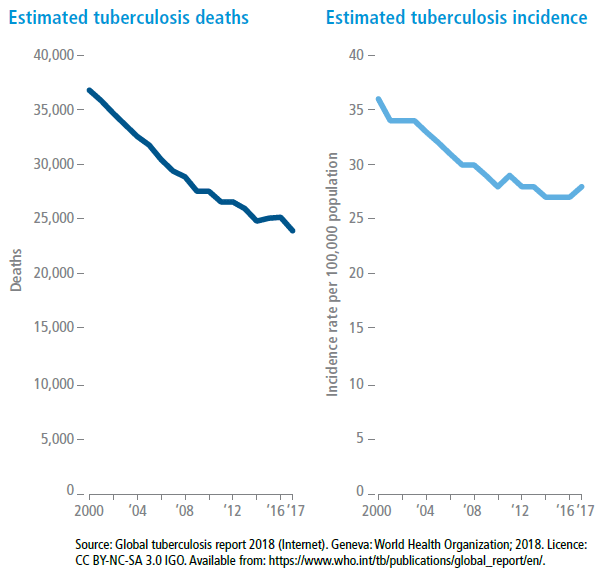
Tuberculosis
Region of the Americas, 2000–2017
IN THE LAST 18 YEARS, DEATHS FROM tuberculosis in the Americas have decreased by 35%, with an average annual reduction of 3%. Tuberculosis deaths have been consistently decreasing, reaching a low of approximately 24,000 deaths in 2017. The estimated incidence has also decreased, although not at the desired rate, with an average annual reduction of 2% between 2000 and 2017. When analyzing the trends, it is important to take into account the implementation of diagnostic methods that allow more cases to be identified, thereby leading to an increase in reported incidence.
HIV
Latin America and the Caribbean, 1995–2018
THE NUMBER OF PEOPLE RECEIVING antiretroviral treatment (ART) has increased exponentially since the introduction of ART provision by national AIDS programs in Latin America and the Caribbean almost two decades ago, in 2000. As a result, deaths due to AIDS started to noticeably decrease. However, while new infections began to consistently decrease in 1995, after 2004, the number stagnated at around 120,000 new HIV infections annually, well short of what is required to achieve the SDG target of reducing new HIV infections 90% by 2030. A combination of evidence-based interventions, as recommended by WHO, must be implemented to prevent new HIV infections. At the same time, efforts must concentrate on scaling up early ART in order to further reduce mortality.
Source:: UNAIDS. Spectrum estimates 2015–2017 (Internet). Available from: https://aidsinfo.unaids.org/. Data on ART treatment: UNAIDS, WHO. Global AIDS Monitoring (GAM) and Global AIDS Response Progress Reporting (GARPR) country reports, 2000–2018.
Note:: The graphic has two y-axes: on the left side are number of HIV cases and number of AIDS deaths, and on the right side are the number of people receiving ART. Please note the difference in the two scales when interpreting data.
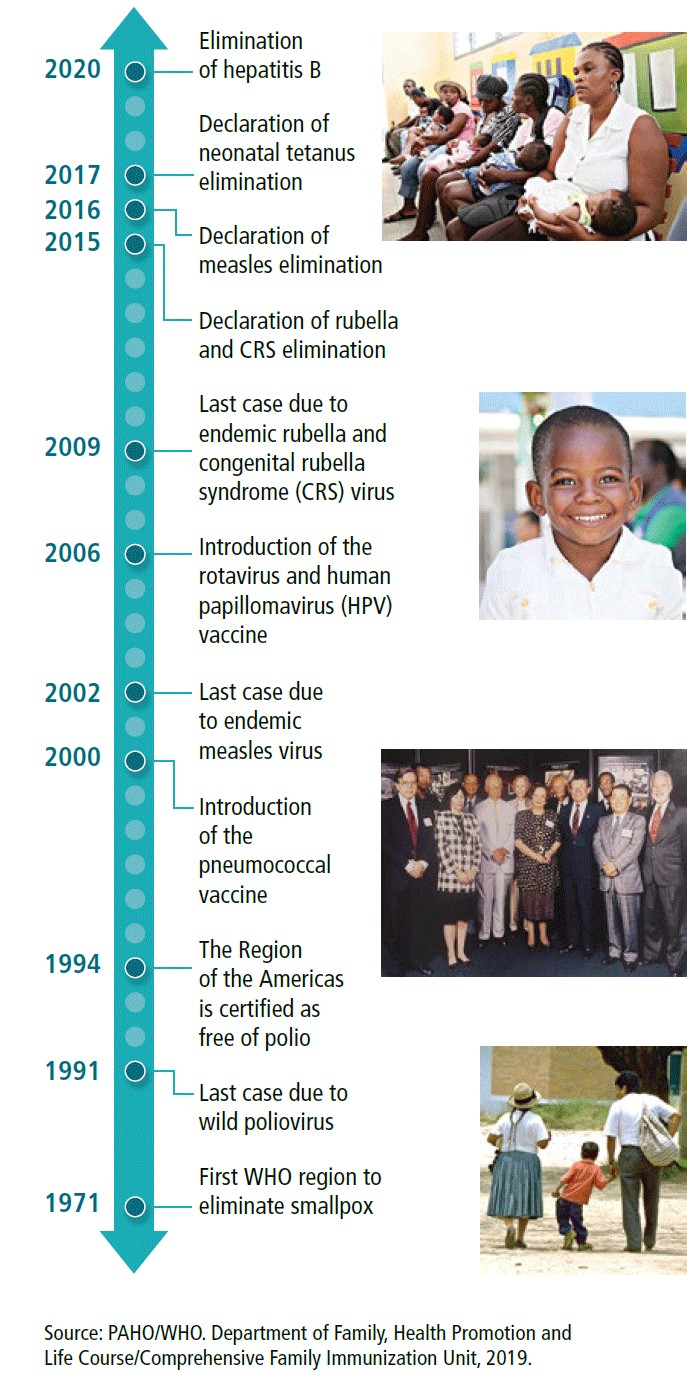
Elimination of vaccine-preventable diseases
Region of the Americas
THE AMERICAS HAS LED THE WAY in the elimination of vaccine-preventable diseases. In 1994, the Region was certified as being free of the indigenous wild poliovirus. In 2015, the International Expert Committee determined that the Region had interrupted the endemic transmission of rubella. In 2017, Haiti achieved elimination of neonatal tetanus, and consequently, the Region of the Americas was declared free of this disease. The Americas is also on track to eliminate mother-to-child transmission of hepatitis B.
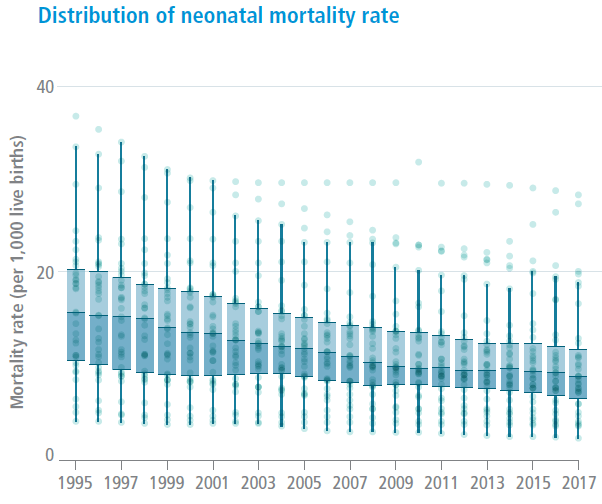
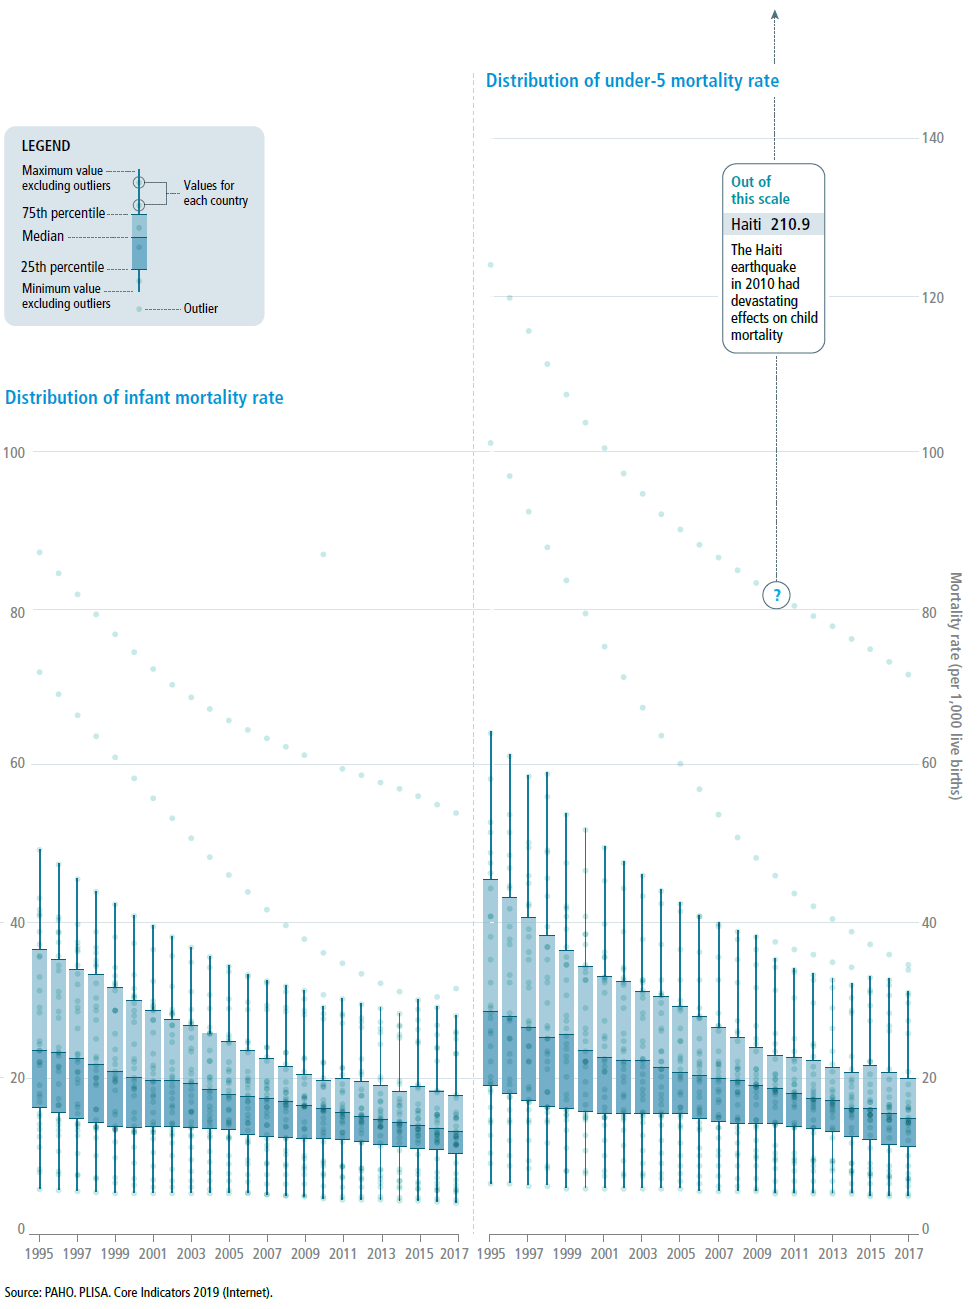
Child mortality
Region of the Americas, 1995–2017
THE AMERICAS HAS MADE REMARKABLE PROGRESS in reducing deaths of children under 5 years of age (under-5 mortality rate). Thousands of children throughout the Region now have a better chance of survival. Remarkably, the median under-5 mortality rate of 28.0 per 1,000 live births in 1995 was nearly halved to 15.0 in 2017. Among the countries of the Americas, a child’s risk of dying before his/her 5th birthday has decreased substantially over time.
The risk of dying in the first year of life (infant mortality rate) was reduced by 55% between 1995 and 2017 in the Region. The regional median decreased from 23.6 deaths in 1995 to 13.1 deaths per 1,000 live births in 2017. In 1995, a wide range of variability was observed for infant mortality rates among countries. As of 2017, mortality rates ranged from about 4 to 59 deaths per 1,000 live births.
The decrease in the risk of dying in the first 28 days of life (neonatal mortality rate) is evident. However, important differences persist between countries in terms of the magnitude and rate of decrease. In 2017, the median neonatal mortality rate in the Region was 8 deaths per 1,000 live births, with a range between 2 and 30 deaths per 1,000 live births.
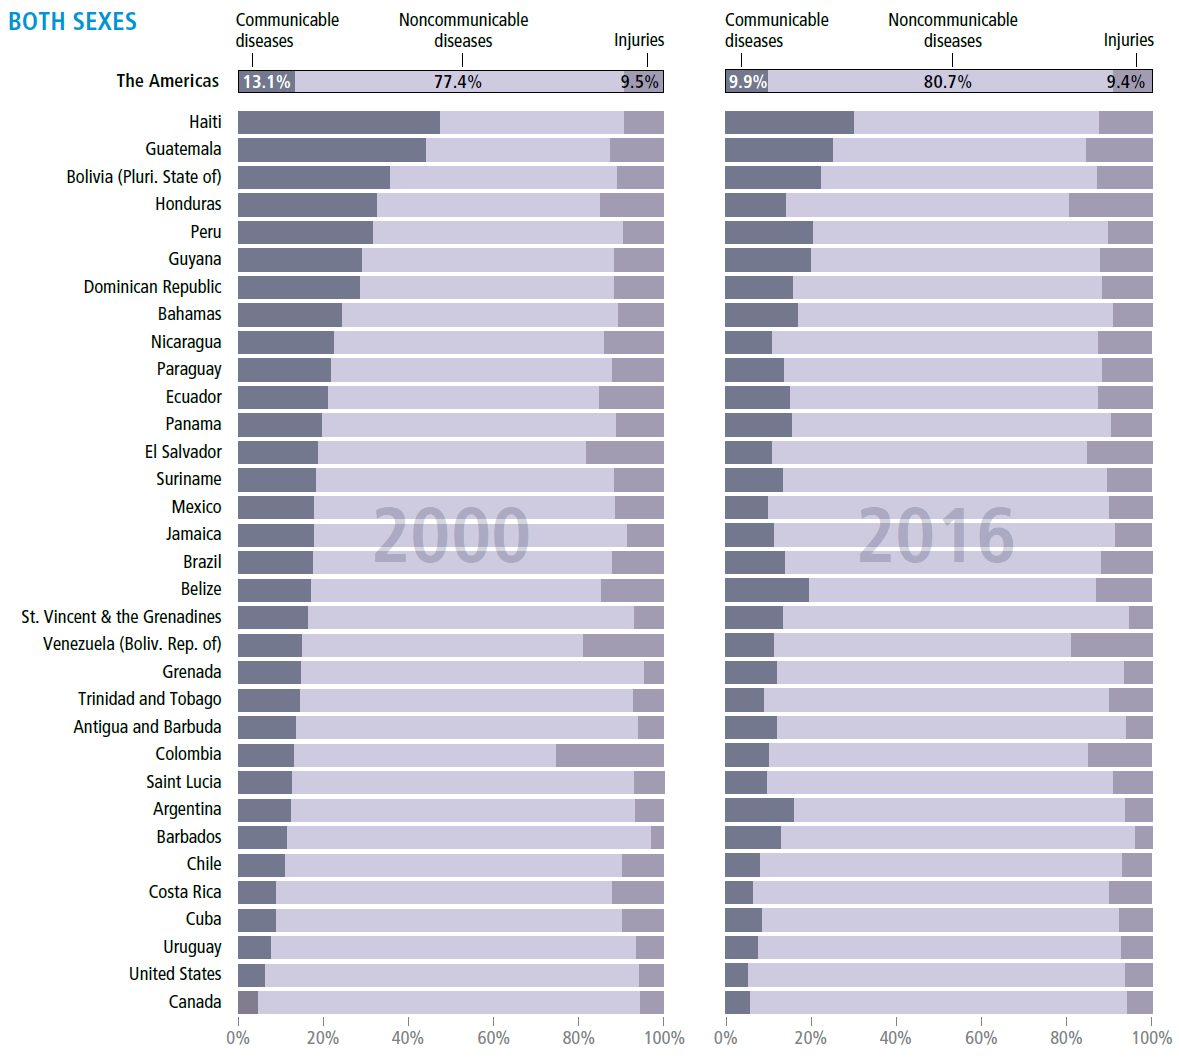
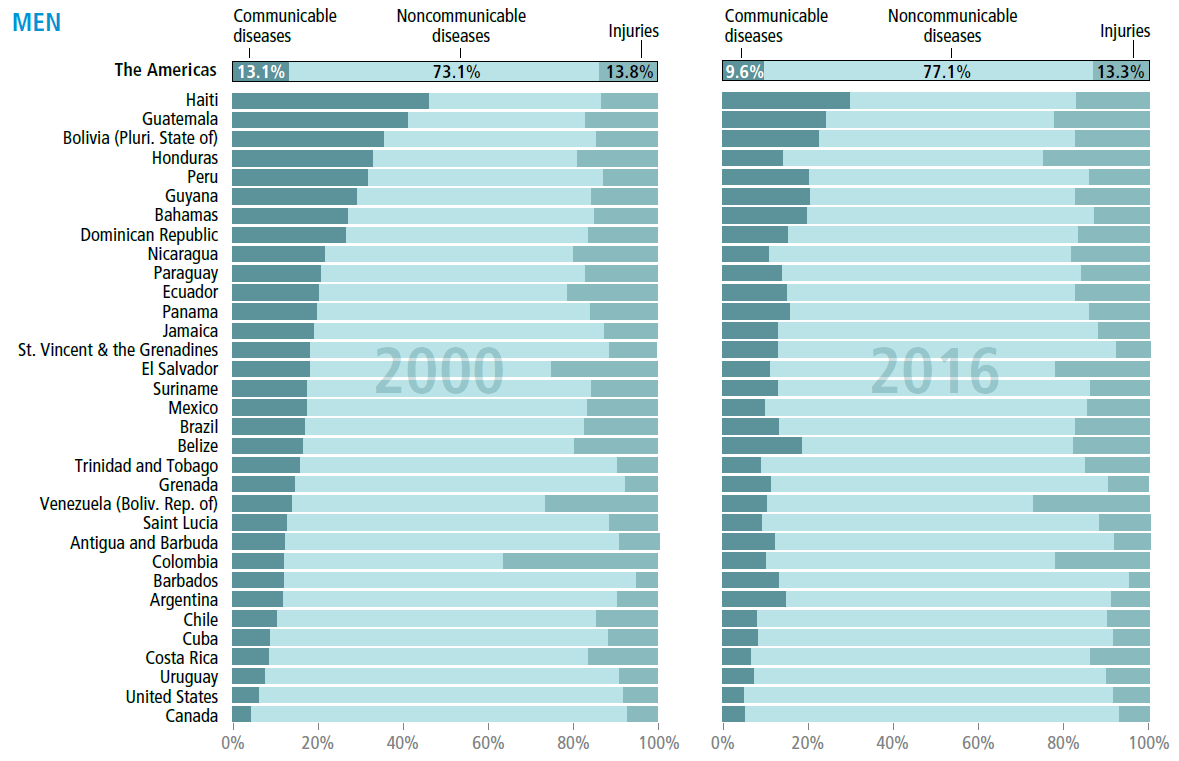
Epidemiological transition
by country, Region of the Americas, 2000–2016
MORTALITY, ANALYZED BY BROAD CAUSE GROUPS, shows a predominance of noncommunicable diseases (NCDs) in 2000. NCDs (including cardiovascular diseases, cancer, diabetes, and others) accounted for 77% of all deaths in 2000, increasing to 81% of all deaths in 2016. Meanwhile, a gradual decrease was observed in deaths from communicable, neonatal, maternal, and nutritional diseases, evident especially in Haiti, Guatemala, and Bolivia, which reported values of 47%, 44%, and 36% in 2000, to less than a third of deaths from these diseases in 2016. In Colombia, the proportion of injuries (including violence and self-harm) was 25% in 1995 and 15% in 2016. Overall, the largest difference between male and female cause of death is death from injuries, which is substantially higher for men than women. The Region continues to face a demographic and epidemiological transition, with the double burden of implementing interventions tailored to the challenges and risks of each population segment, with the participation of multiple sectors, actors, and civil society.
Out-of-pocket expenditure in health spending
UNIVERSAL HEALTH, THE FOUNDATION of an equitable health system, is a fundamental aspiration for the Americas. An essential attribute to achieve universal equity is the capacity of the health system to guarantee access irrespective of the ability to pay. To track such capacity, out-of-pocket spending as a percentage of the current health spending (OOP%CHE) is used as a core indicator. The trend lines in the graph highlight the indicator's general progress in the Americas—particularly, its high level (30% regionally) and downward drift.
The bubble graph is a weighted equiplot that shows the distribution of OOP%CHE across income quartiles (i.e., the four colored bubbles) for 2000, 2005, 2010, and 2015, illustrating the persistence of inequality gaps. In fact, the gap between the poorest quartile of countries and the richest increased between 2000 and 2015. In 2015, while the richest quartile spent half as much as in 2000, the poorest quartile has shown little improvement.
The size of each bubble represents the population size of each quartile. The distance between the extreme quartiles represents the magnitude of the absolute inequality gap.
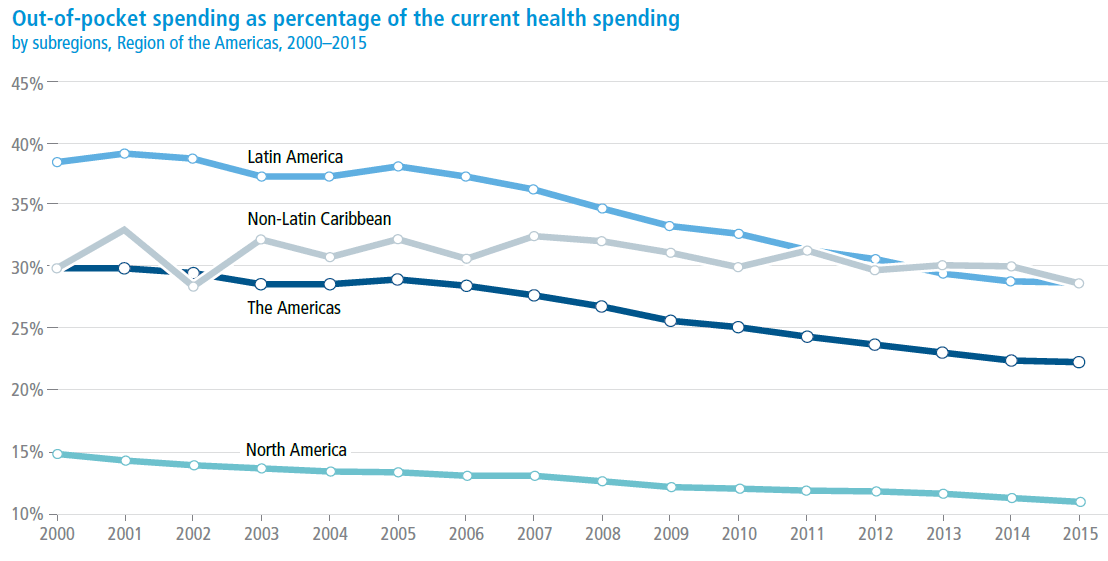
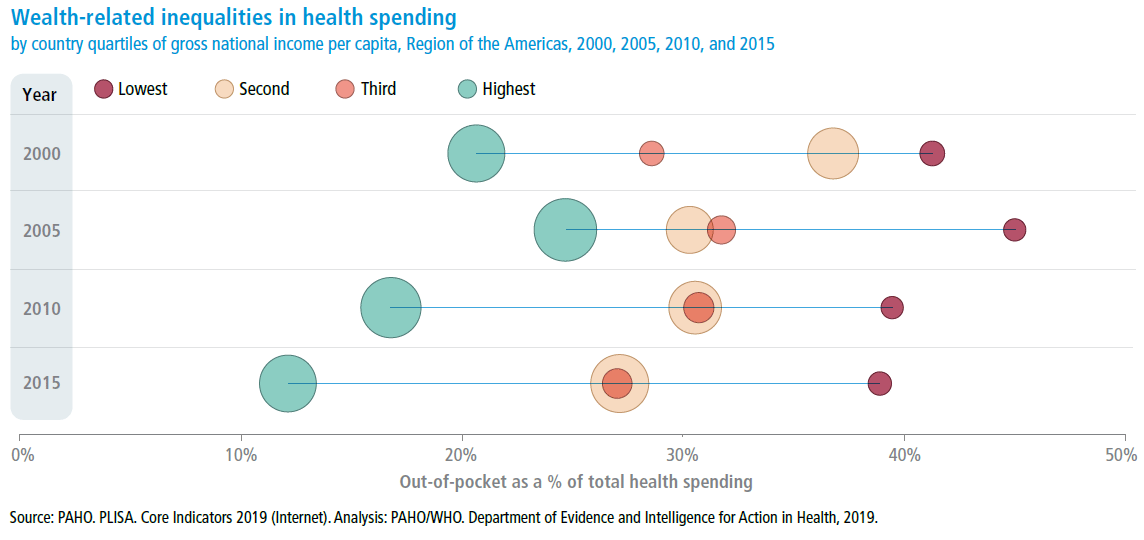
Source: PAHO. PLISA. Core Indicators 2019 (Internet). Analysis: PAHO/WHO. Department of Evidence and Intelligence for Action in Health, 2019.